Run your clinic, not reports
Get quick insights about your clinic, in simple English.
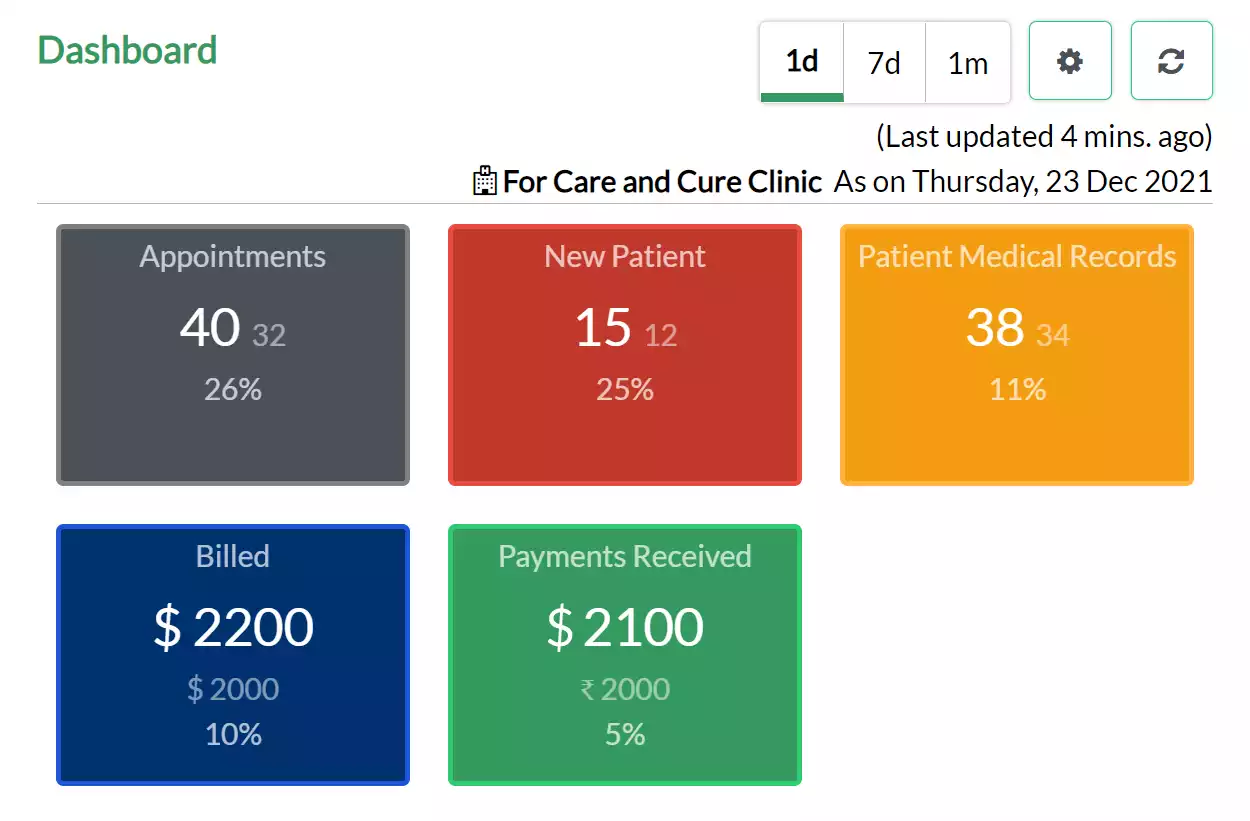
Numbers that are easy to understand. Presented to you with context so that you can see exactly what’s going on. No-Clicks required.
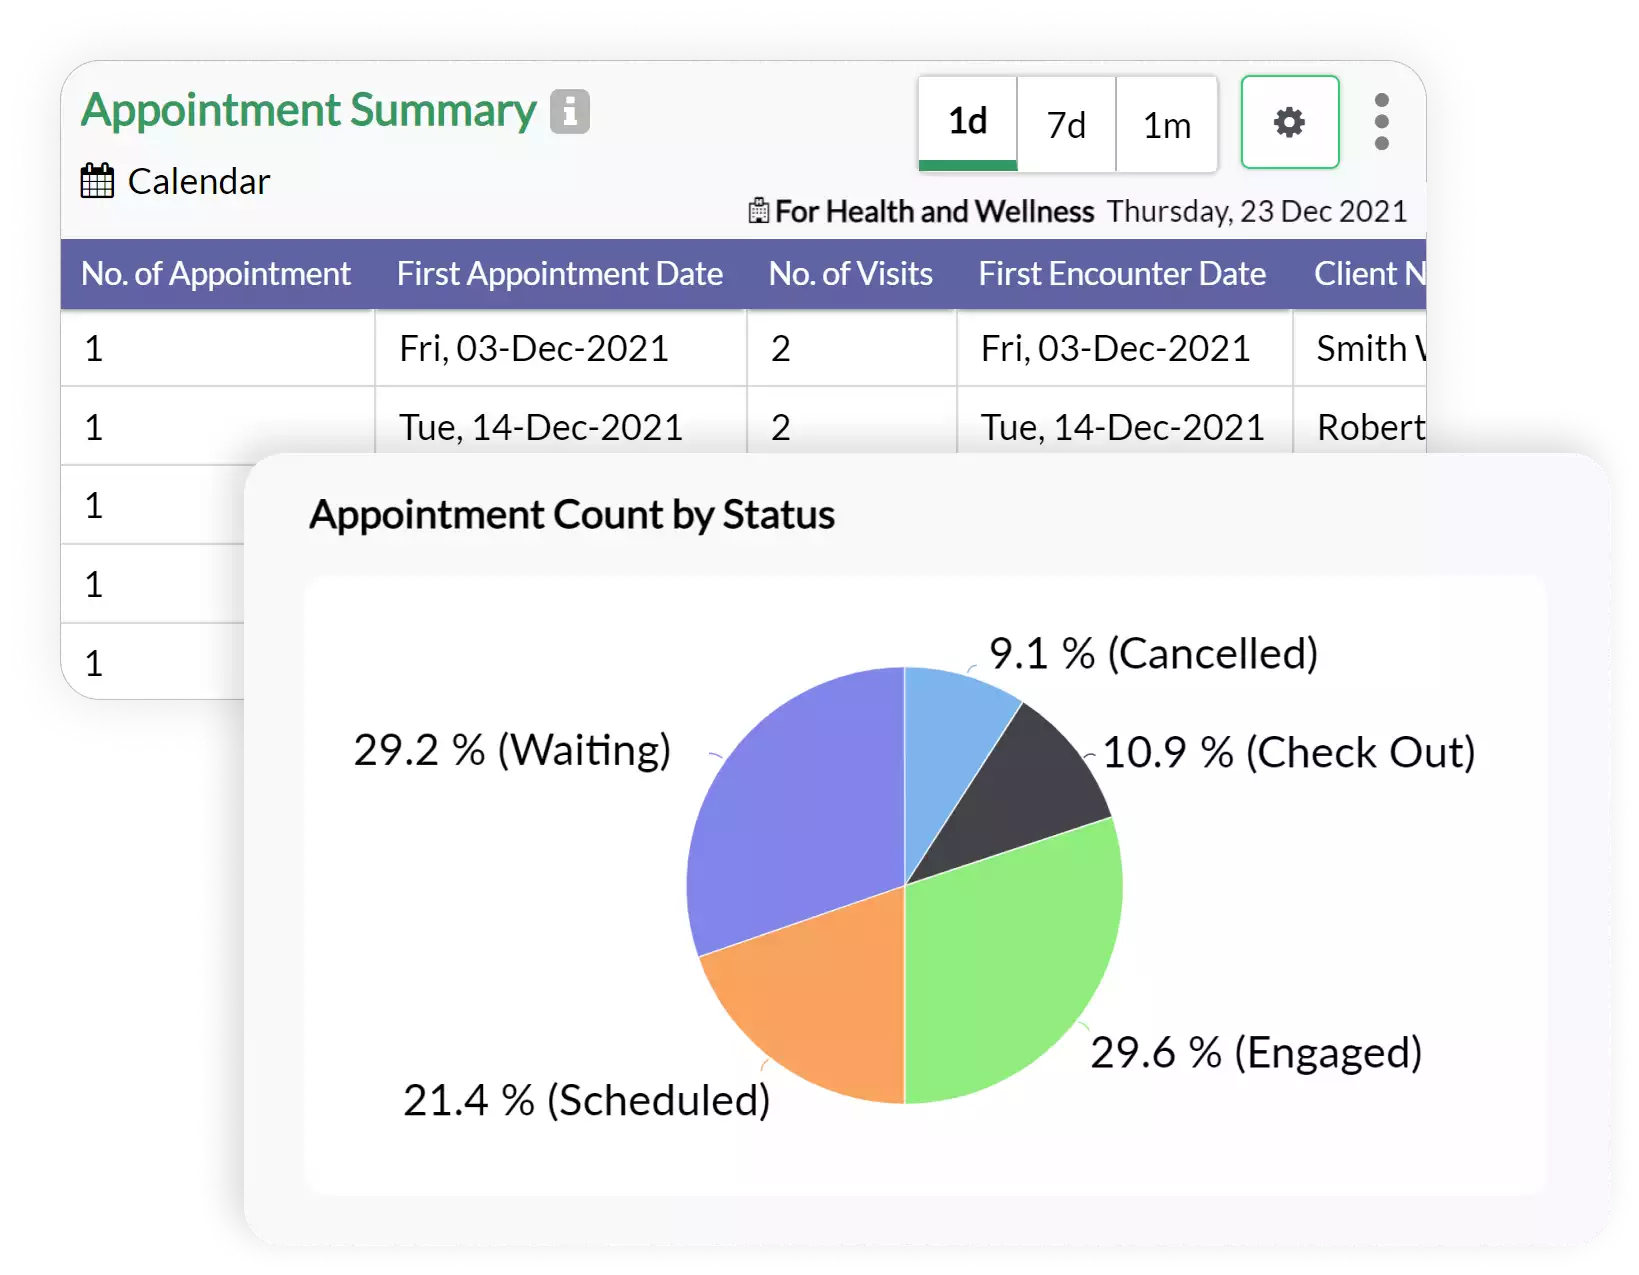
You can quickly scan through ready-made pie charts. Or look at the raw data, export to excel and review in detail.
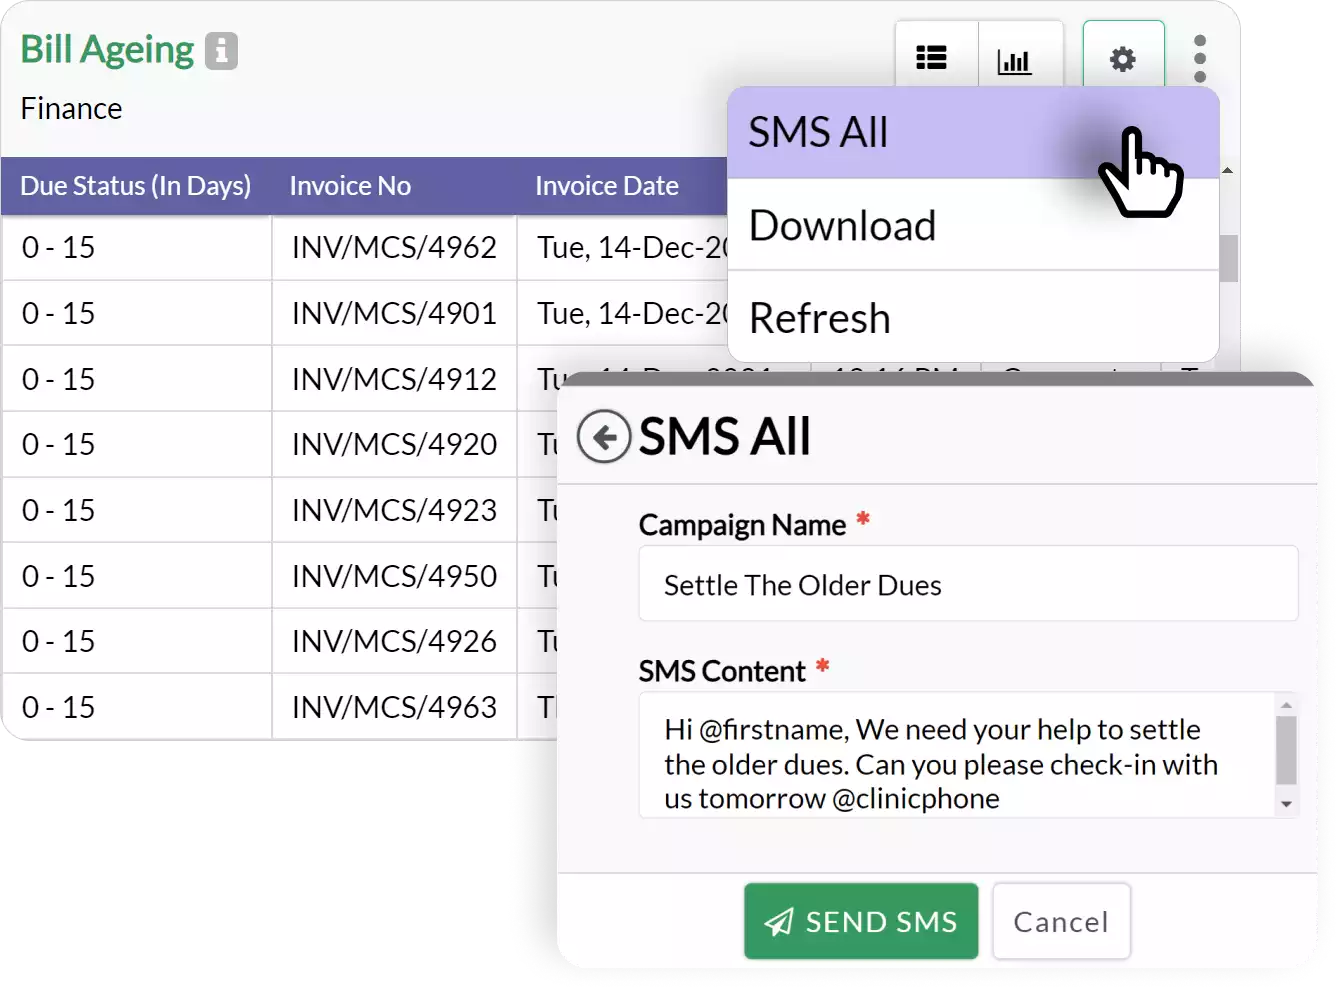
Want to send a payment reminder to all accounts due over 90 days? Just open the Bill Ageing report and click SMS Campaign. 2-Clicks to complete any campaign.
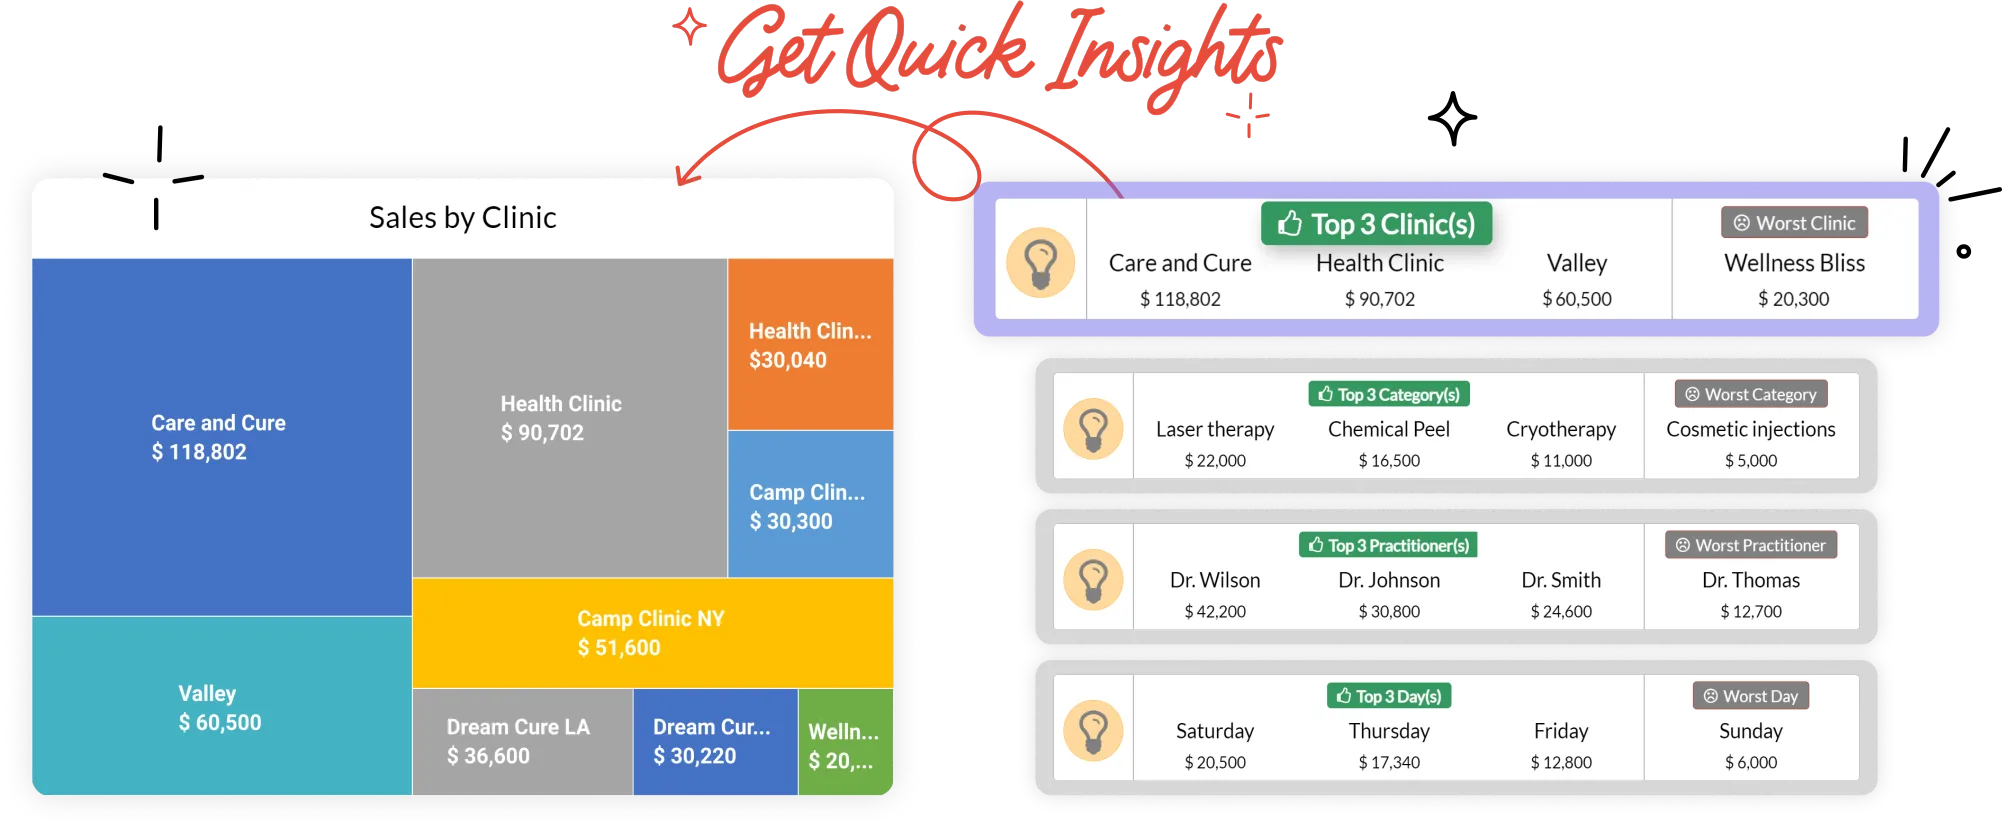
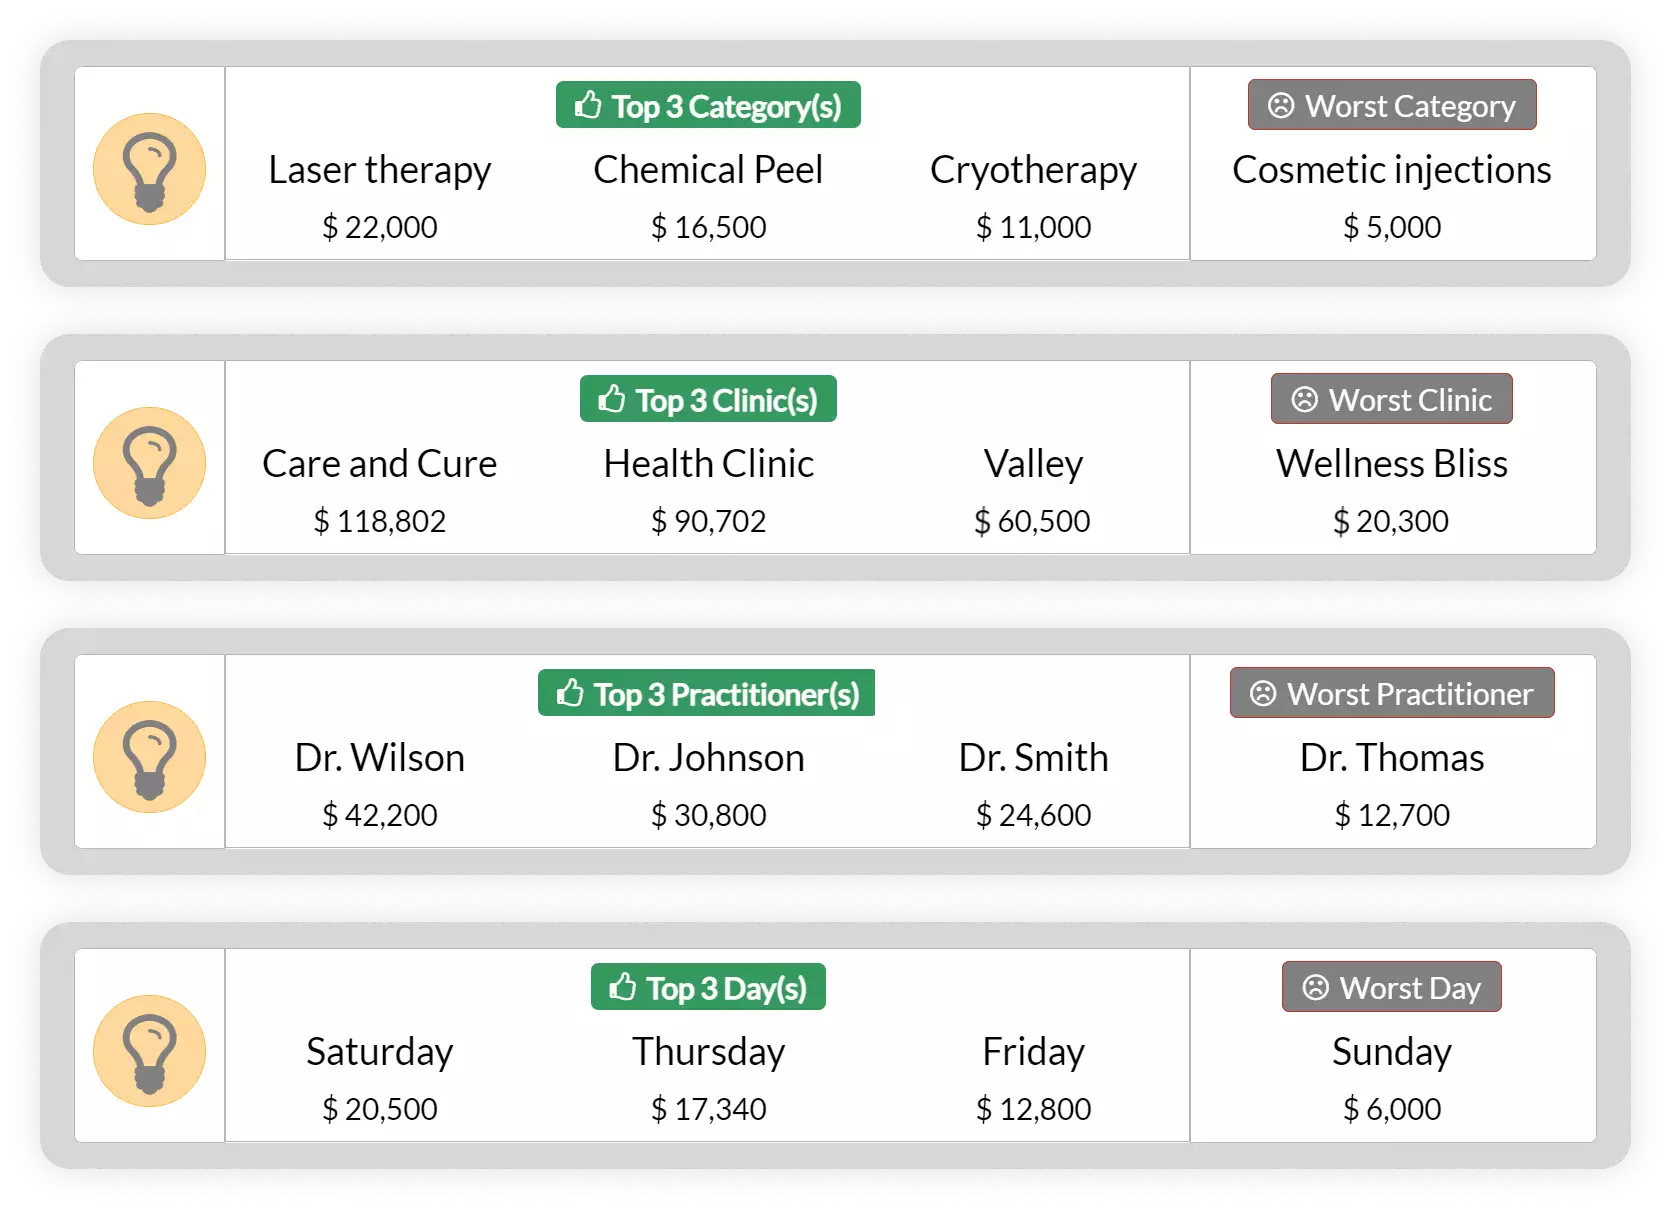
We love jazzy looking dashboards, but we struggle when it comes to understanding all of it. This is why we built a Business Intelligence tool for you, from the ground up. Clinicea Analytics focuses on providing insights, but in the form of simple questions and answers.
Which cities are bringing in bulk of my revenues?
Who are my top 3 practitioners?
Which clinics are the top contributor to profits?
Which are the slowest days of the week?
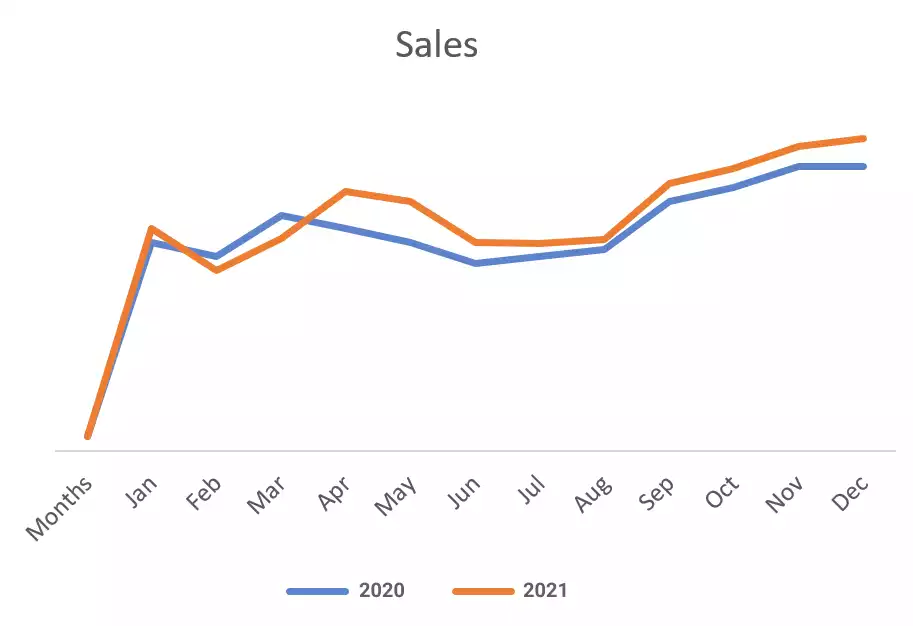
We show you numbers and charts with the sole target that comparison should be intuitive. So, when you see the current year’s performance, it gets overlaid with the performance of the previous 12m.
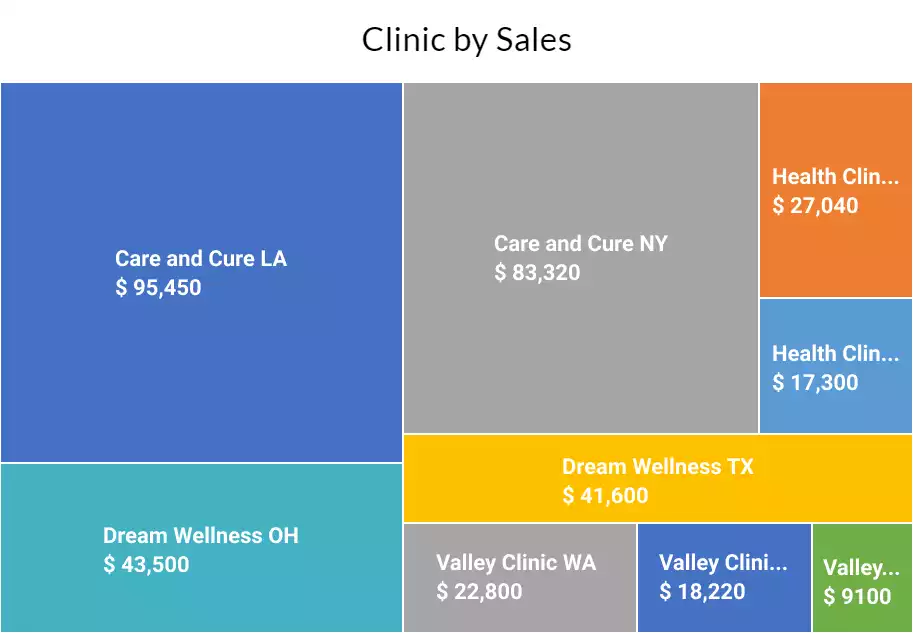
Similarly, when your run reports for multiple clinics, we switch focus to Tree-maps. They are coloured boxes where the size of the box itself indicates which is the larger clinic for the metric in question. You only need to scan instead of read, to get the most out of each chart.
Clinicea is smart enough to limit access to report data based on which location a clinic staff is authorised to work in. Revolving managers can access data of multiple clinics, but only as per the locations they have been authorised to work in.


See live the cutting-edge technologies your Clinic can have. 1-on-1 walkthrough by a Product Specialist.
- Customizable EMR
- Patient Engagement
- Virtual Assistant